Delving through data to find hidden stories
Each clip in the Sound & Vision archive tells its own story. However, there are many more stories that are hidden to the casual eye. These are the tales told by the archive metadata, information attached to each clip. Sound & Vision data scientists, metadata experts and curators are working together to unlock the potential of this metadata. Read the blogpost of Mari Wigham.

Each clip in the Sound & Vision archive tells its own story. However, there are many more stories that are hidden to the casual eye. These are the tales told by the archive metadata, information attached to each clip. Sound & Vision data scientists, metadata experts and curators are working together to unlock the potential of this metadata. Read the blogpost of Mari Wigham.
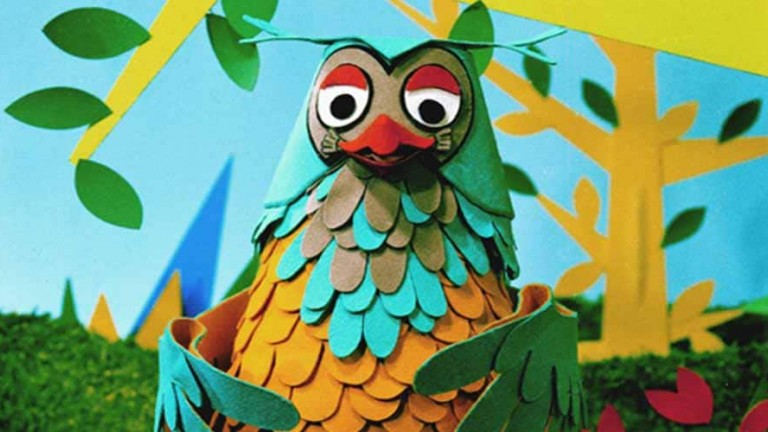
Meneer de Uil (Mister Owl) - Sound & Vision possesses puppets from the 'Fabeltjeskrant'
I have a confession to make. As a small child, I would sneak under our Christmas tree to try and work out what was in my presents. One year, smoothing over the paper on an intriguing box, I could read the word ‘d-a-t-a’. With no regard for the fact that I was incriminating myself, I went to ask my parents, ‘What is data?’. ‘Number sheets’, my dad replied. I was devastated. What a boring present! Until Christmas morning, when I unwrapped the parcel to reveal a data cassette recorder - my first games computer.
Big data
Despite all the hype around big data, it’s still not a word that gets many people excited. When thinking of Sound & Vision, people think of historic Polygoon news films, of nostalgic children’s programmes, of the Dutch computer games canon or wartime radio broadcasts.
Each of these crown jewels tell a different story, and is of enormous value and interest to the right person. Portals for the general public at Beeld & Geluid and the CLARIAH Media Suite for researchers allow people to search through this treasure chest to find their very own pearls.
"This is where data, that grey little word, starts to unfold its true colours."
But what about the bigger picture? Someone completely new to Sound & Vision is faced with an empty search box, or given a suggested subject, but has no idea of all the possibilities the archive offers. Equally, for someone trying to find the answer to a specific question, the ability to search for and view clips may not be enough. A list of search hits for ‘Pim Fortuyn’ does not give you a good idea of the available material relating to this highly influential politician, and watching every news report on immigration is a very labour-intensive way to find out how the language used to describe immigrants has changed over time.
This is where data, that grey little word, starts to unfold its true colours. All the clips in the Sound & Vision collection are described in ‘metadata’, a large amount of very diverse information, from who appears in the clip, to when it was broadcast and on which station, from what was said during the broadcast, to technical details such as the type of carrier the material is stored on. By analysing this metadata, we can step back from the individual archive items, and discover patterns and trends that tell us about the archive as a whole, or help to answer specific questions.
Surprise!
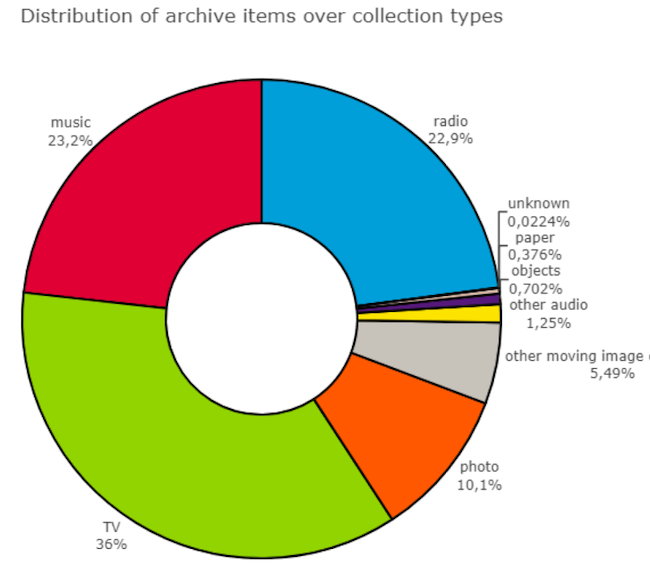
The data can often hold surprises. For example, probably everyone knows that Sound & Vision stores television and radio. But did you know that nearly a quarter of our collection is music? Or that we also possess physical objects, such as puppets from the Fabeltjeskrant and the iconic Loekie bumpers?
Edison First recording on a wax roll
Or, if you have knowledge of the media sector, you might expect the earliest items in our collection to date from 1919, the first radio broadcast in the Netherlands. A graph of the items over time reveals our oldest item is actually from 1873 - a copy of Edison’s first recording on a wax roll.

We can find the connections in our collection, seeing the relationships between people, programmes, locations and subjects. For example, Hilversum is associated with the top three subjects ‘omroep’, ‘radio’ and ‘kinderen’, while Rotterdam is associated with ‘havens’, ‘voetbal’ and ‘jeugd’. We are working towards publishing our collection as linked data, allowing us to connect to other cultural institutions such as the Koninklijke Bibliotheek, or encyclopaedic sources such as wikidata. This will reveal the bigger picture behind the media in our collection, and make it possible to answer much more complicated questions, such as how the guests of a TV programme are distributed over gender or political ideology.
Metadata
Delving deeper, we can zoom in on specific parts of the collection and analyse the metadata. For example, we can find the most frequently occurring words in the descriptions of Nieuwsuur programmes, and compare these between the years 2012 and 2017. This gives a quick impression of how preoccupations in current affairs have changed, from the economy and the euro in 2012, to Donald Trump in 2017. During the Clariah Summer School, humanities researchers used the metadata from the Sound & Vision archive to examine topics as wide-ranging as gender representation and attitudes to immigrants.

The archive does not only reflect changes in society. Broadcasting technology, broadcaster politics, archive selection policy and even the techniques and policies of metadata creation have all left their fingerprints on the archive, and these can appear in unexpected ways. For example, the ‘bump’ in archive items during the ‘60’s and ‘70’s is due to a large intake of international news items, part of an arrangement between broadcasters in different countries to exchange material. The second most frequently occurring broadcaster in the archive is ‘niet van toepassing’ (not applicable), indicating again the strong influence of the international news items, but also the significant presence of ‘in-between’ programmes - short informational films (for example traffic safety) or party political broadcasts - that do not belong to a particular Dutch broadcaster.
Fascinating stories
All these influences mean that the knowledge and experience of Sound & Vision experts is unmissable in correctly interpreting our data. As not everyone has the benefit of being able to have a cup of coffee with one of our archivists, we have worked with them to create an experimental ‘archiefstats’ website Visualising the archives, showcasing some of the fascinating stories our data tells. For Media Suite researchers with specific questions, we provide Jupyter Notebooks, shareable documents containing code, text and graphics, that provide them with tools for visualisation and analysis, and also essential background information to help them find the answers they need.
Data has its own stories to tell, and with media streaming into the archive daily, and new technologies such as face and speaker recognition, those stories are becoming richer and more numerous. Combining Sound & Vision expertise with the enthusiasm and curiosity of our users, we can finally let those stories be heard.
About the author
Mari Wigham is a software developer in the Discovery department of Sound & Vision. She develops innovative technology to unlock media archives for users, in particular researchers, and to provide them with new insights from the data.
The development of the archiefstats website and Jupyter Notebooks was made possible by the support of CLARIAH.

